
STUDENT ACHIEVEMENT AT SOUTHERN ADVENTIST UNIVERSITY
Southern Adventist University has identified multiple measures that are used to monitor student achievement and that are appropriate for the institutional mission and goals, the students served by the University, and the degree programs offered. Performance on these measures are evaluated regularly to foster improvement. The institutional student achievement measures are:
- Overall Graduation Rate Including Key Student Completion Indicator (KSCI),
- Three- and six-year graduate student completion rates,
- Performance by graduating seniors on national standardized tests,
- First-time pass rates on licensure exams in the University's large professional degree programs, and
- Rates of undergraduate job placement and acceptance into graduate and professional programs.
Data and analysis for each measure are found in the sections below.
1. Overall Graduation Rate Including Key Student Completion Indicator (KSCI)
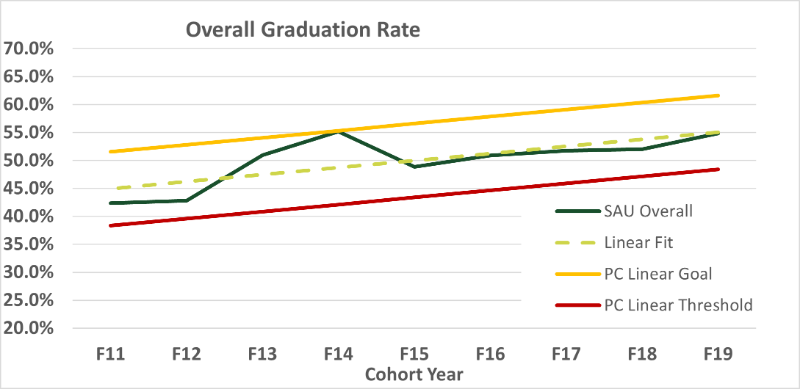
Figure 1. Overall 150%-time Graduation Rate (traditional IPEDS graduation rate)
Goal: Linear fit to historic data + 2 standard deviations
Threshold of Acceptability: Linear fit to historic data - 2 standard deviations
Initiatives to improve graduation rates over the past several years have likely contributed to the upward trend. The anomalous jump in the rate for the Fall 2014 cohort might be a direct result of a ~10 credit-hour reduction in the General Education requirement beginning with the 2016-1017 academic year. This change was made with the intention of making it possible for students to change their major at least once prior to the end of their second year and still be able to graduate in four years. Many students starting in the Fall 2014 term found it advantageous to shift to the 2016-2017 Catalog and benefit from the reduced General Education requirements. If this is the primary cause for the increase, some additional increases would be expected for the next two years with a plateau starting with the Fall 2016 cohort.
The gold and red lines correspond to the University's goal and threshold of acceptability respectively. Because of the noticeable linear trend in the overall graduation rate data, the goal and threshold of acceptability were based on the standard deviation of the error in the linear fit for prior years. Specifically, data for prior years is fit with a straight line (dashed line). The standard deviation is calculated for difference between the linear fit and the data for each year. The goal line is the linear fit shifted upward by twice the standard deviation. Conversely, the threshold line is the linear fit shifted downward by twice the standard deviation. The data should rarely fall below the threshold or above the goal, making the change discussed above for the Fall 2014 cohort noteworthy.
Graduation Rate by Demographic Groups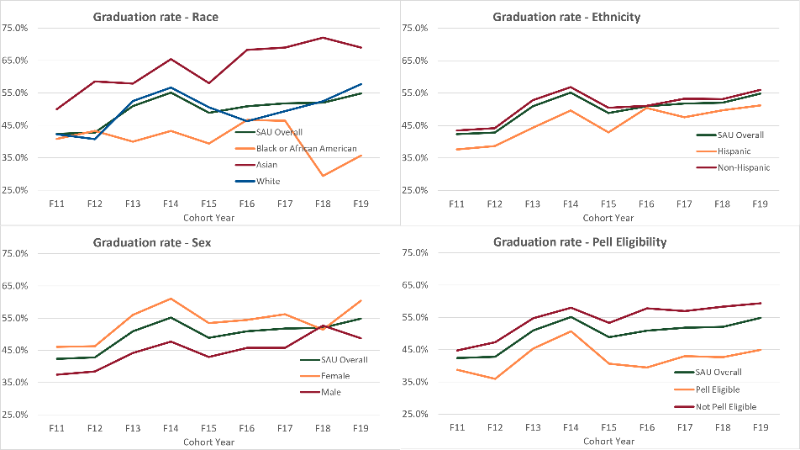
Figure 2. Graduation rate (150% time) disaggregated by (a) race, (b) ethnicity, (c) sex, and (d) Pell eligibility
It is encouraging to see that every demographic group shows an increase in graduation rate for the cohort years shown. However, some specific features are worth highlighting.
- The spread in the graduation rate is decreasing for Pell Eligibility and Ethnicity comparison groups, and is staying roughly the same for Race comparison groups. As the racial and ethnic diversity in our student body increases, we will need to identify specific ways we can support our Hispanic and Black or African American students on their timely completion.
- Male students are lagging farther behind in what appears to be at least a two-year trend. Additional analysis is needed to understand this trend.
Alternative graduation metrics are also used in reporting and decision-making on campus.
These results allow for additional benchmarking. For example, Figure 3 shows the 6-year
undergraduate graduation rate collected and reported by the Council of Independent
Colleges (CIC). Southern Adventist University’s data (green) are compared to the mean
and top quartile of the CIC cohort of institutions in the Southeast region. Again,
the Fall 2014 cohort rate is above the goal.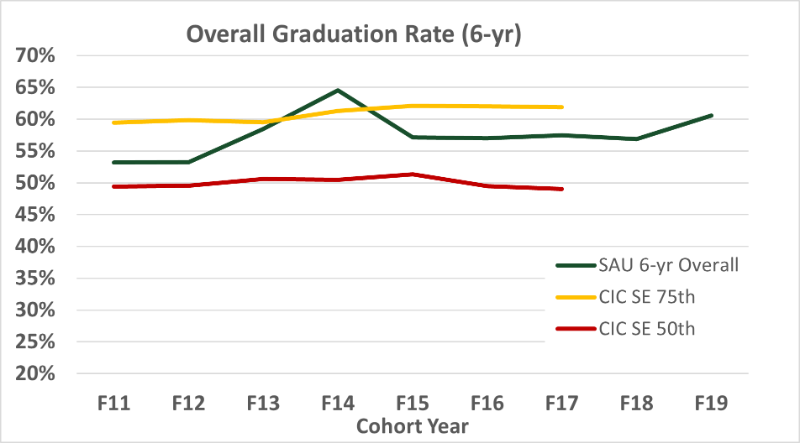
Figure 3. Comparison of Southern Adventist University's 6-year undergraduate graduation rates
with median and upper quartile Council of Independent Colleges (CIC) Southeastern
institutions
(Source: Council of Independent Colleges (CIC) Key Indicators Tool 2021)
2. Three- and Six-Year Graduate Student Completion Rates
Southern offers eight masters degrees and one doctoral degree, with the School of Nursing comprising about half the graduate student body. Because the vast majority of graduate students are in master's-level program, and approximately half of the University's graduate students are part time, the University has chosen to track both three-year and six-year completion rates. These are calculated as the number of students who are awarded degrees within three or six years of their enrollment date, as a percentage of graduate students who enrolled in the same year.
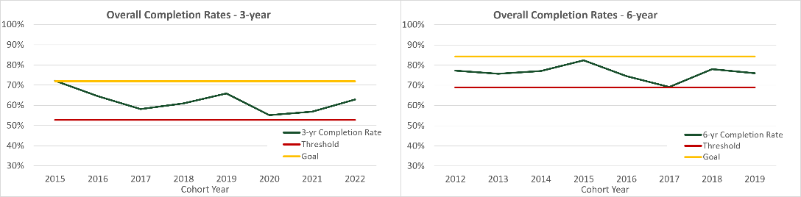 Figure 4. Graduate student overall (a) 3-year and (b) 6-year completion rates.
Goal: Historic average + 2 standard deviations
Threshold of Acceptability: Historic average - 2 standard deviations
The three-year graduate completion rates appear to fluctuate around a mean value of just under 30% with a standard deviation of about 5%. The six-year graduate completion rates appears to fluctuate around a mean value of just under 40% with a standard deviation of about 10%. As with the undergraduate completion rates, the goal (threshold) lines are set by adding (subtracting) twice the standard deviation to (from) the mean value of recent historical data.
3. Performance of Graduating Seniors on National Standardized Tests
The ETS Proficiency Profile is administered to graduating seniors during their final year. Two types of results are obtained from this assessment:
- Institutional ranking on reading, writing, and mathematics scores.
- Percentages of students who are proficient in academic skills of reading, writing, and mathematics and in general academic content areas of humanities, social sciences, and natural sciences.
Table 1 shows the longitudinal rankings of Southern Adventist University mean score compared to the mean scores of other institutions in the same Carnegie class.
Table 1. SAU Rank Compared to 59 Cohort Institutions (Percentiles)
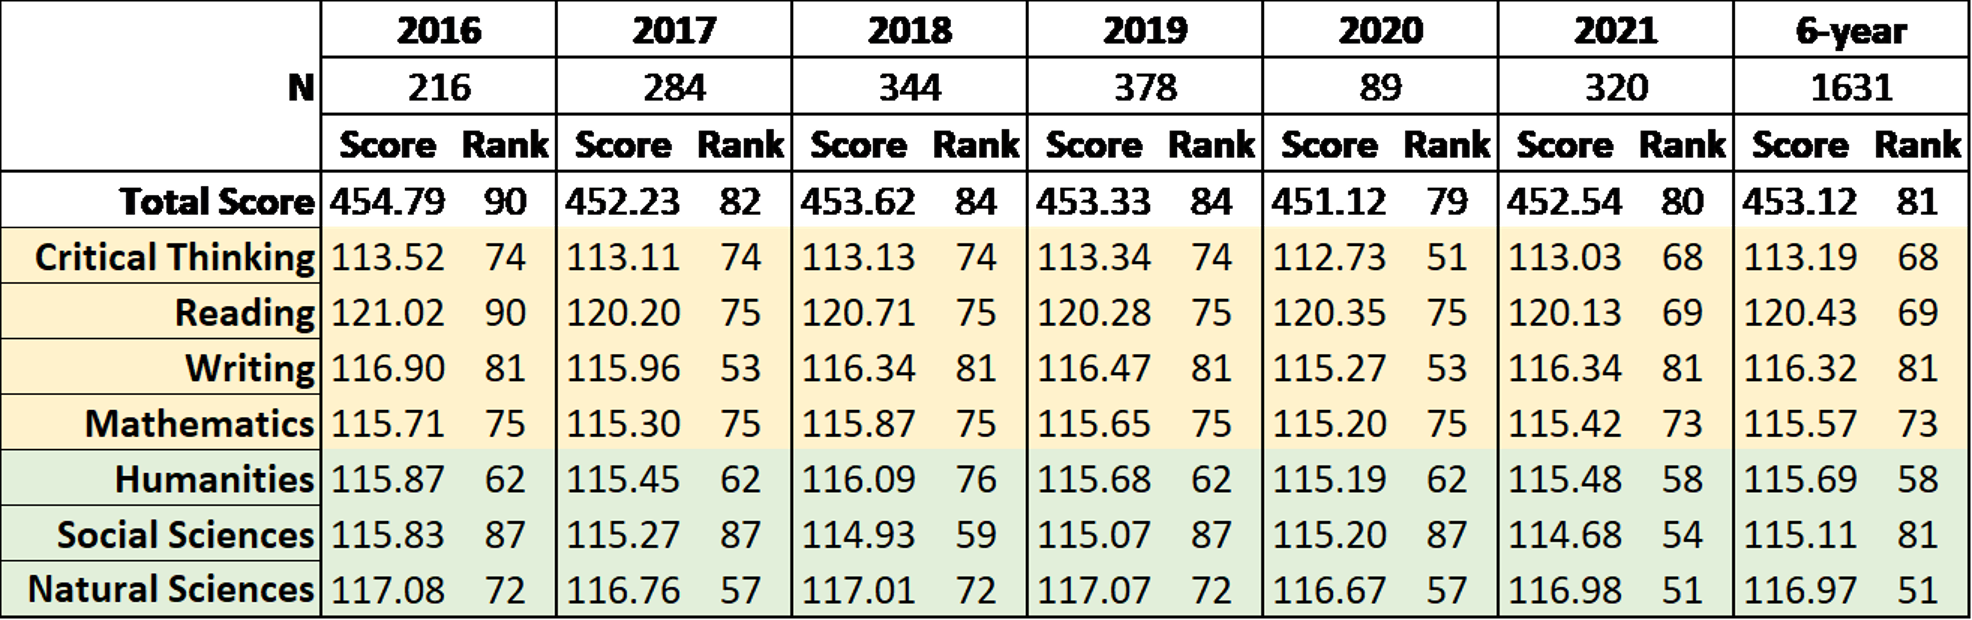
Goal: Rank of 70th percentile or higher in each dimension
Threshold of Acceptability: Rank of 50th percentile in each dimension
While seniors have several options to take the exam throughout the academic year, most don’t take it until late in the Winter term. The number of tests taken in the 2020 cycle was significantly lower than other years. This is because only students who had taken the assessment in person prior to the shift to online instruction part way through the Winter term.
The threshold of acceptability for this ranking measure is set at the Carnegie cohort median (50th percentile). Because of the small number of institutions in the cohort (59) and the binning reported by ETS, very small changes in the mean score can change the ranking substantially. For example, Table 1 shows that for 2019–2021, the mean Natural Science subscores were 117.07, 116.67, and 116.98. Based on the 2021 ETS Proficiency Profile Comparative Data Guide for Comprehensive institutions, these subscores correspond to significantly different percentiles (71st, 51st, and 51st percentiles respectively).
Table 2. ETS Proficiency Profile: Percentage of Students Scoring Proficient or Marginally Proficient
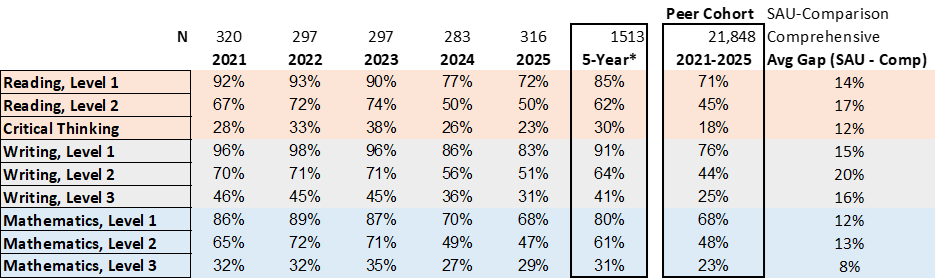
Proficiency results are shown in Table 2. Southern consistently compares favorably to its Carnegie-class peers at each level, with the six-year average percentages ranging from 3% to 11% higher than the peer cohort.
4. First-Time Pass Rates on Licensure Exams in the University's Large Professional Degree Programs
Table 3. NCLEX First-time Pass Rate
|
Year |
National |
SAU |
|
2011 |
88 |
89 |
|
2012 |
90 |
93 |
|
2013* |
83 |
89 |
|
2014 |
82 |
76 |
|
2015 |
84 |
83 |
|
2016 |
85 |
82 |
|
2017 |
87 |
88 |
|
2018 |
85 |
92 |
|
2019 |
88 |
92 |
|
2020 |
87 |
93 |
*Anomalous increase in test difficulty starting in 2013.
Goal: At or above the National mean pass rate
Threshold of Acceptability: Pass rate of 85%
Nursing students make up more than one fourth of the student body, so this is an important measure for a significant population of the student body.
Since 2017, first-time pass rates have been higher than the 85% and also higher than the national mean. The School of Nursing has kept in place the steps it took to help students better prepare for the licensure exam after the difficulty increased substantially in 2013. Those steps included altering admissions criteria, revising progression standards, increasing testing stringency, adding additional learning support measures, and adding a monetary incentive for timely and successful licensure exam attempts.
Praxis and edTPA First-Time Pass Rates
Southern Adventist University's teacher education program prepares elementary and secondary teachers for success in passing licensure exams. Since 2019, applicants for Tennessee state teaching licensure have been required to submit edTPA scores in place of one of the previously required Praxis exams. The transition period between these licensure exams has been extended through 2021 due to issues related to COVID-19. The table below shows the shift in the number of Praxis and edTPA exams taken by Southern Adventist University students during the transition period.
Table 4. PRAXIS II and edTPA First-Time Pass Rates
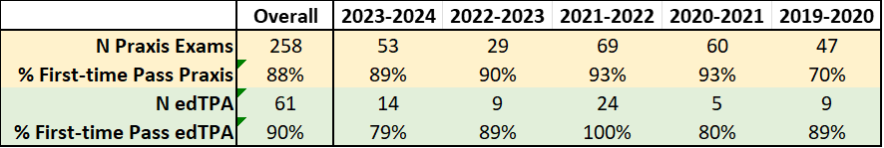
Goal (working): 85%
Threshold of acceptability (working): First-time pass rate of 72%
National comparison can be made for the edTPA assessment using the pass rate based on the recommended passing score of 42. Using this criterion for passing the assessment, the national first-time pass rate in 2018 would have been 72%, and for states that require edTPA, it would have been 74%. In practice, states are allowed to select their thresholds for passing, and many use a value less than 42. Because of this ambiguity, and the fact that we currently only have a three-year history with the edTPA assessment, the University is still in the process of setting goals and thresholds for this assessment.
5. Rates of Undergraduate Job Placement and Acceptance into Graduate and Professional Programs
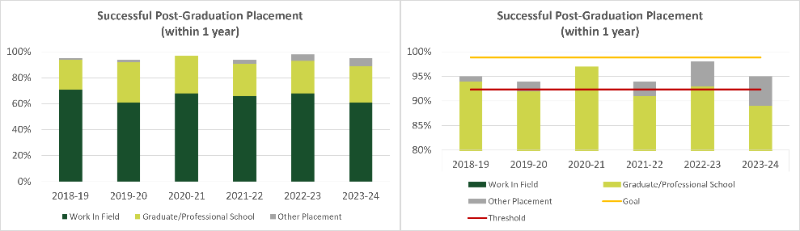
Figure 5. Post-graduation successful placement rate: (a) full-axis and (b) expanded to show
the top of the axis with goal and threshold
*Only 60% of academic units reporting in 2016-2017
Goal: Historic average + 2 standard deviations
Threshold of Acceptability: Historic average - 2 standard deviations
Southern Adventist University considers the following post-graduation outcomes to be successful:
- Finding work in an area related to the chosen academic field,
- Enrollment in graduate or professional School, and
- Other placements such as completing a second undergraduate degree or engaging in post-graduating mission work or a formal study abroad opportunity.
Figure 5 shows that successful placement outcomes remain steady at 94%, with only small variation. Only graduates with known placement outcomes are used when determining success rates. One notable feature in the data is an anomalously high fraction of students who graduated during the 2019-2020 academic year and subsequently enrolled in graduate or professional school. This may be due, in part, to difficulty entering the workforce during the COVID-19 pandemic.
The University also is interested in decreasing the number of unknown placement outcomes.
Success in achieving this goal would not only give a more accurate measure of placement
outcomes, but it would also indicate the University is staying in better contact with
its alumni. Figure 6 shows longitudinal data for rates of unknown placement outcomes.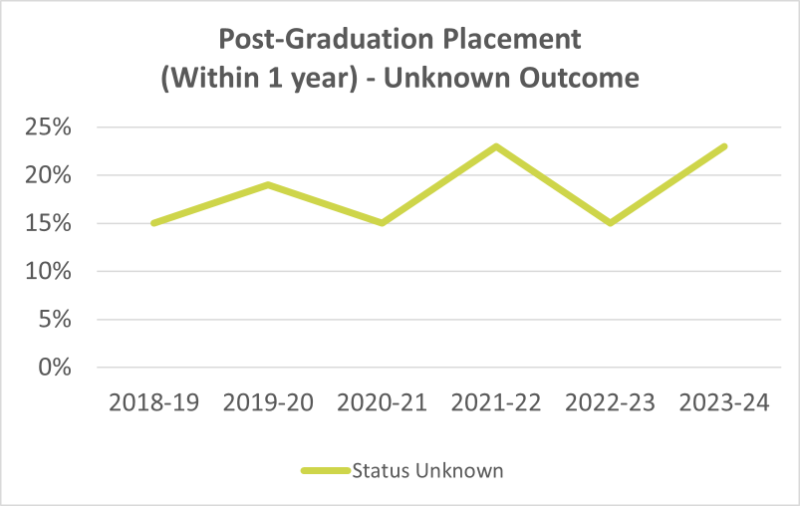
Figure 6. Longitudinal rate of unknown placement outcomes
*Only 60% of academic units reporting in 2016-2017
The decline in unknown outcomes seen in the data indicates that efforts on the part of academic schools and department, in collaboration with the Alumni Office, are successful. In 2020, the University purchased a subscription to a service that monitors LinkedIn for alumni information with the goal of further improving connections with alumni. The University anticipates that use of this service will yield a further reduction in the number of unknown placement outcomes.